How to Use the Year-End Mileage Report in Your Bouncie Dashboard
At the end of the year, mileage suddenly becomes important. Whether you are preparing for tax season, reviewing fleet utilization, calculating deductible miles as a self-employed professional, or simply tracking how much your teen drove, one thing is consistent: you need a reliable year-end mileage report you can actually trust.
The challenge is rarely a lack of data. It is the lack of organized, reliable reporting. Spreadsheets get outdated. Manual logs get skipped. Receipts disappear. Trying to piece together a full year of vehicle activity can quickly turn into a time-consuming project.
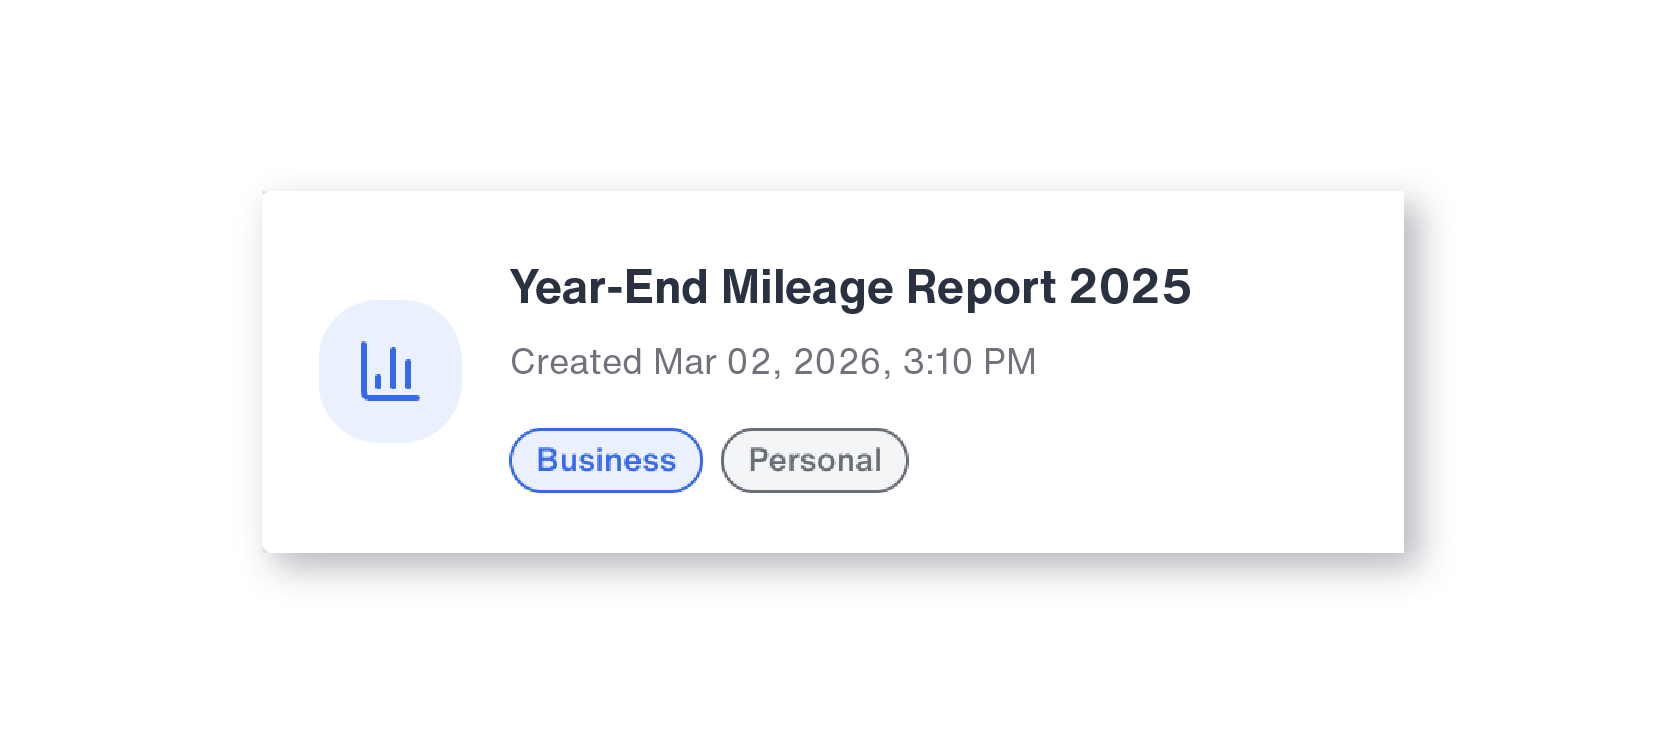
That is exactly why Bouncie includes a Year-End Mileage Report built directly into the app, giving you a complete annual mileage summary without any manual work. It takes the trip data already collected throughout the year and transforms it into a clear, professional summary that is easy to review, filter, and download. Instead of scrambling for numbers, you can generate a comprehensive annual mileage report in just a few clicks.
What Is the Year-End Mileage Report?
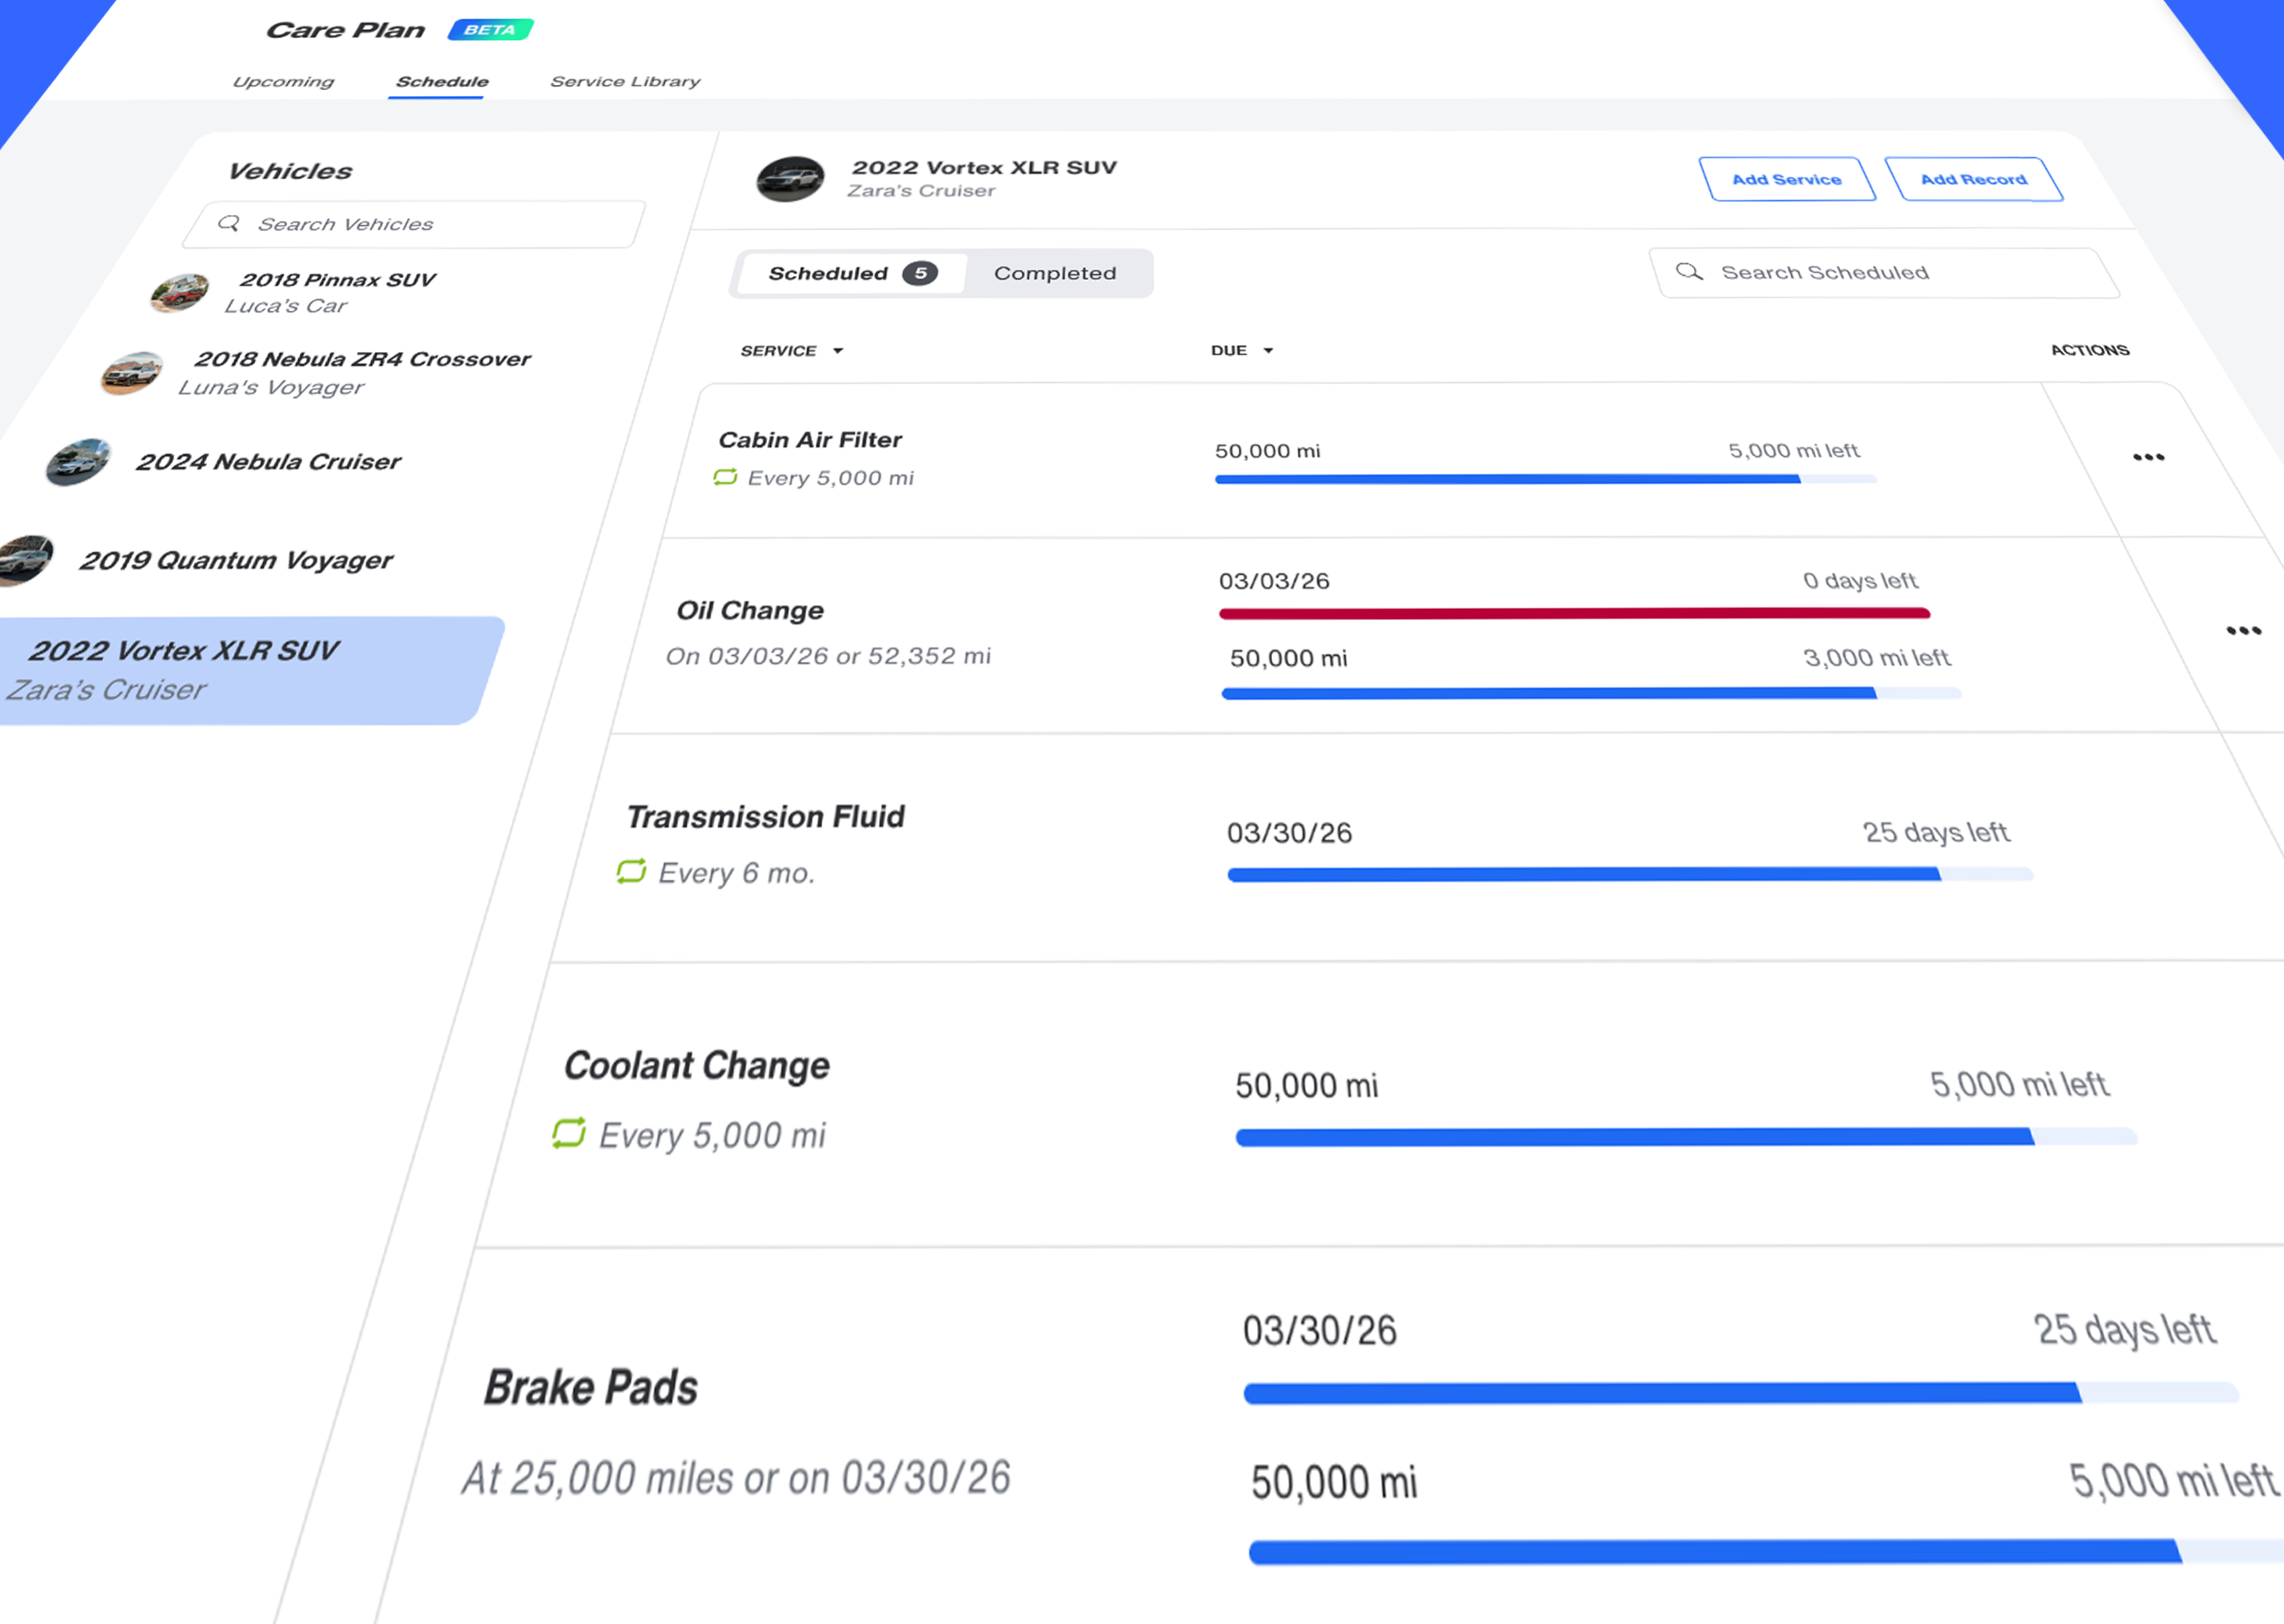
The Year-End Mileage Report is a built-in feature that generates a centralized annual mileage summary for all vehicles with an active Bouncie device installed. It is accessed through the Reports section of your dashboard and covers a full calendar year of trip data. Rather than reviewing individual trips or running multiple smaller reports, this feature gives you a complete overview of an entire calendar year, combining summary-level insights with detailed breakdowns by vehicle.
Inside the report, you will find:
- Monthly mileage trends across all vehicles
- Average monthly miles
- Peak and lowest mileage months
- A breakdown of annual mileage per vehicle
- Trip counts and average monthly usage
It is designed to be simple to run and easy to understand, whether you manage two vehicles or twenty.
Reporting includes only vehicles with an active Bouncie device installed. If a device was removed while a vehicle was being driven, mileage for that period will not appear in the report. Consistent installation ensures complete annual visibility.
With that foundation in mind, here is a step-by-step walkthrough of how to generate, read, and download your Year-End Mileage Report in Bouncie.
How to Run the Year-End Mileage Report in Bouncie
To generate the report, follow these steps. First, log into your Bouncie account on the web. From the upper left corner, click the hamburger menu and select Reports. You will see the Year-End Mileage Report listed as an option. Click Create Report and select the calendar year you want to review. From there, you can customize the report using tags to filter which trips are included.
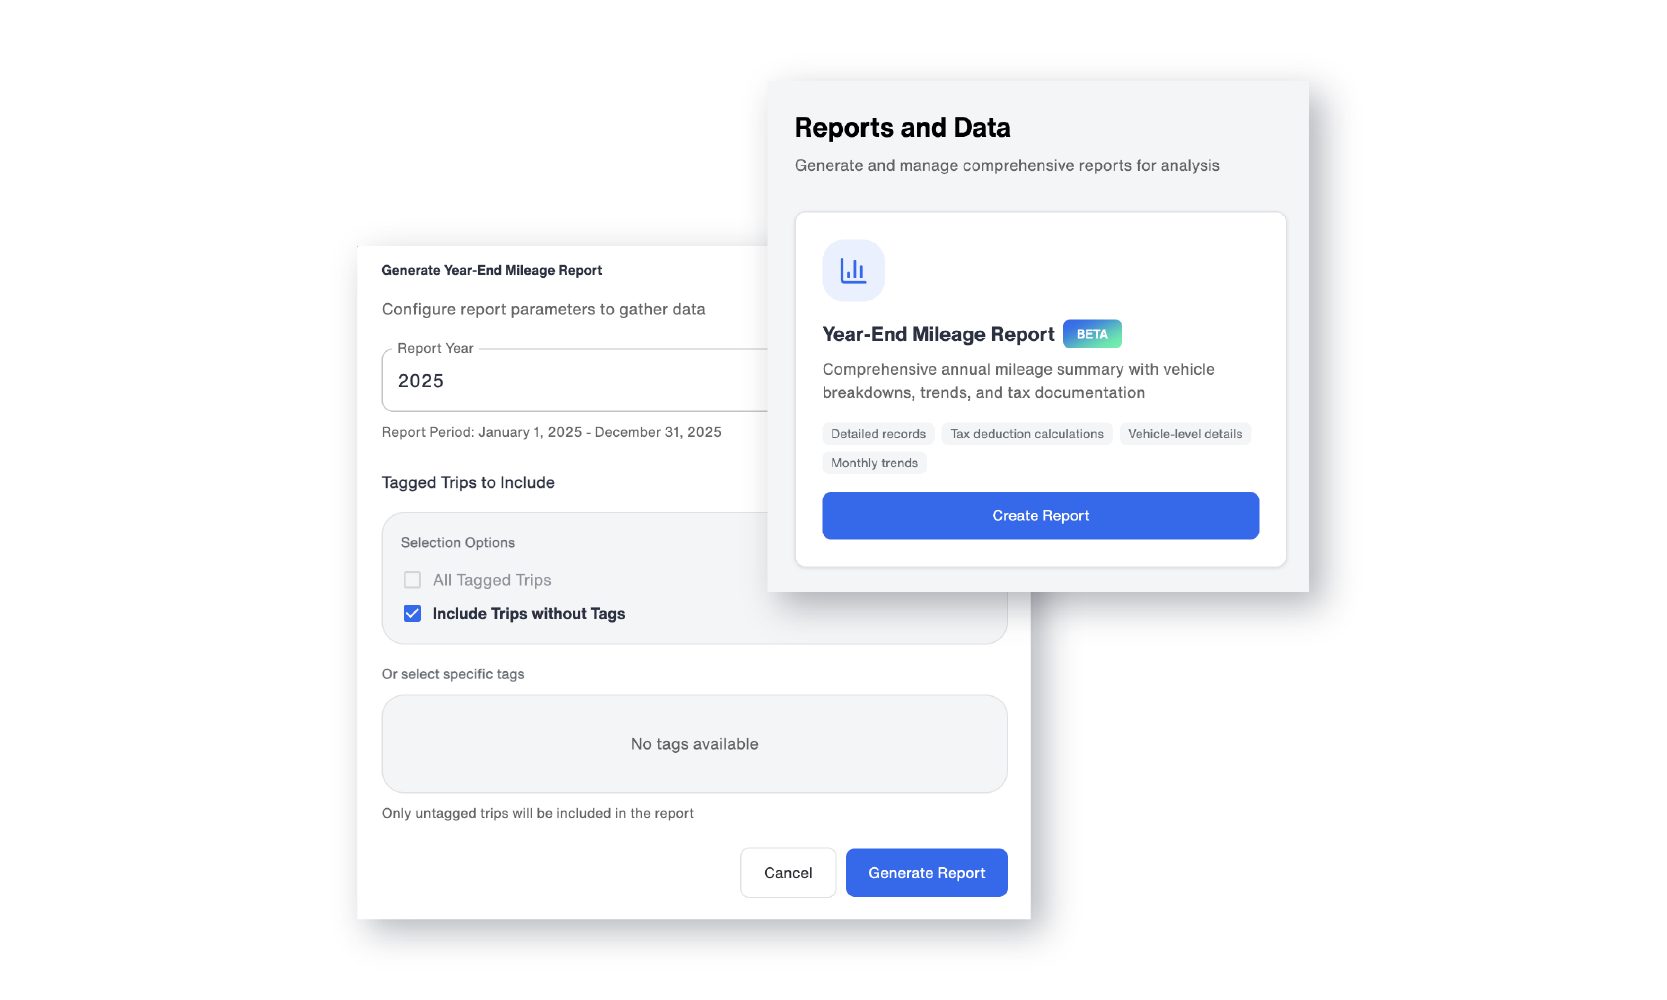
If you don’t use tags, selecting untagged trips will include all trip data for the year. If you use tags to categorize trips, you have flexible filtering options. You can include:
- All tagged trips
- Only trips without tags
- Both tagged and untagged trips
- Specific tags you choose
This is especially valuable for businesses that separate business and personal mileage, track job sites, or organize trips by department. For example, a contractor could generate a report showing only mileage associated with a specific project. A small business owner could isolate reimbursable miles from personal travel.
Once generated, your report will be saved under the Generated Reports section of the Reports and Data page. You can return to view previously generated reports at any time, making year-over-year comparisons easy.
Once the report is generated, it is organized into two main sections: a monthly mileage trend summary and a vehicle-level breakdown. Here is what each section contains.
Reading Your Year-End Mileage Report: Monthly Trends Explained
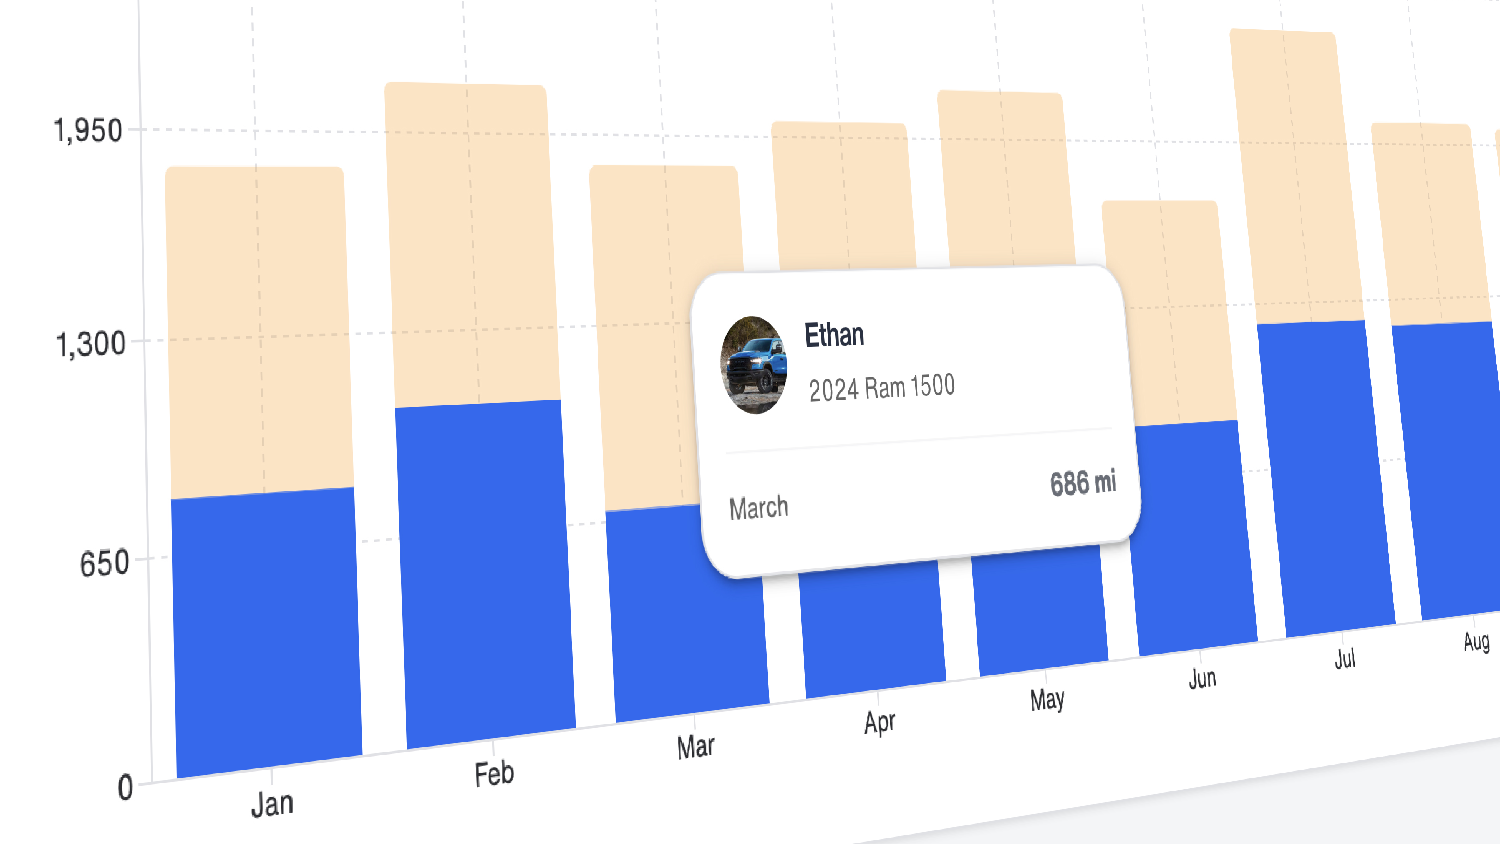
The first section of the report is the Monthly Mileage Trends summary. It appears at the top of the report and provides an at-a-glance overview of vehicle usage across the full calendar year, including three key metrics and an interactive graph.
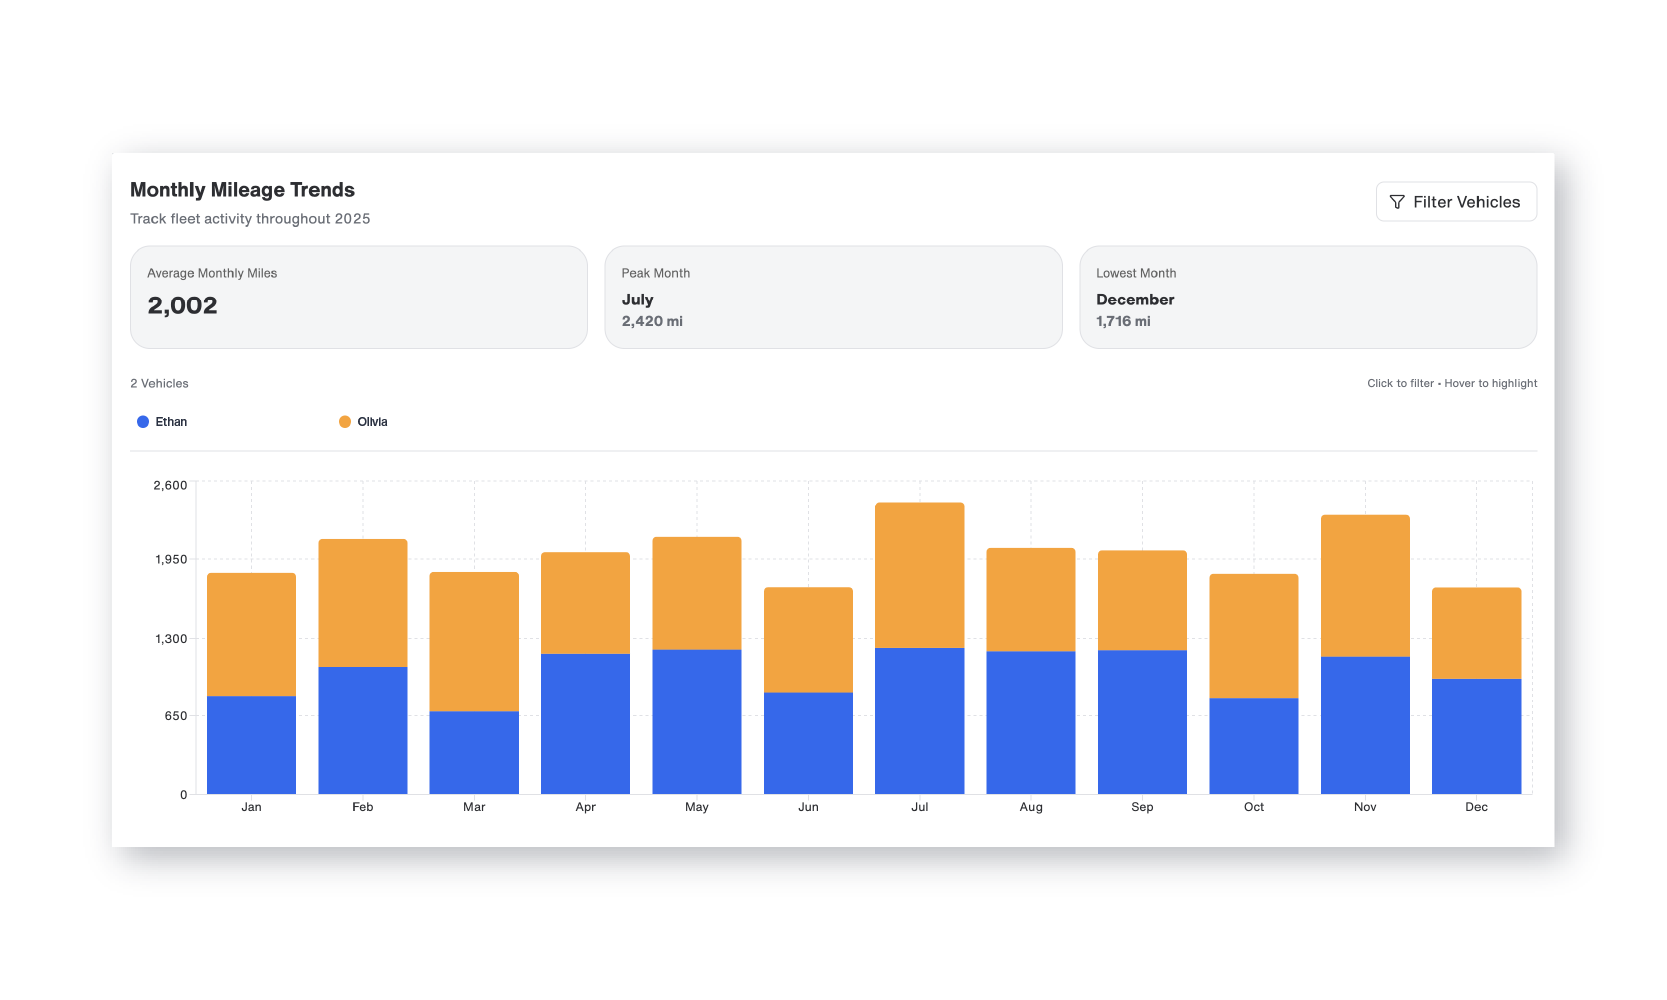
Average Monthly Miles shows the average number of miles driven per month across all Bouncie-installed vehicles. This provides a simple benchmark for understanding overall usage.
Peak Month identifies the month during the year when the highest total miles were driven. For seasonal businesses, this can confirm busy periods. For families, it may reveal travel-heavy months such as summer.
Lowest Month highlights when vehicles were driven the least. That insight can be just as valuable for understanding downtime or underutilization.
Below these metrics, you will find the Mileage by Month graph. This is a hover-interactive graph that displays mileage by vehicle, color-coded for clarity. When you hover your mouse over any bar in the graph, the details for that specific month and vehicle appear instantly.
This allows you to quickly compare performance across vehicles without navigating away or running separate reports. It is a simple but powerful way to identify patterns.
For fleet managers, this can help spot vehicles that are consistently overused or underused. For business owners, it can support more accurate forecasting for fuel, maintenance, and budgeting. For parents, it can provide clarity around driving spikes that may warrant a conversation.
After reviewing the monthly trends, the second section of the report provides a vehicle-level breakdown with individual mileage totals, trip counts, and average usage for each Bouncie-installed vehicle.
Vehicle-Level Breakdown in Your Year-End Mileage Report
The Vehicle-Level Breakdown is a detailed data table that lists every Bouncie-installed vehicle included in the report. Each row represents one vehicle and displays five data points.
- Vehicle: The name of the vehicle as it appears in your dashboard. If the vehicle includes tagged trips, a dropdown caret appears next to the name. Clicking it allows you to expand and view the tagged breakdown within that vehicle’s annual data.
- VIN / Plate: This column displays the vehicle’s VIN and license plate number. If you see a dash in this field, it indicates that one of those pieces of information has not been entered into the system.
- Total Miles: The total number of miles driven by that vehicle during the selected year.
- Avg/Month: The average monthly mileage for that vehicle across the year.
- Trips: The number of start-stop trips recorded during the reporting period.
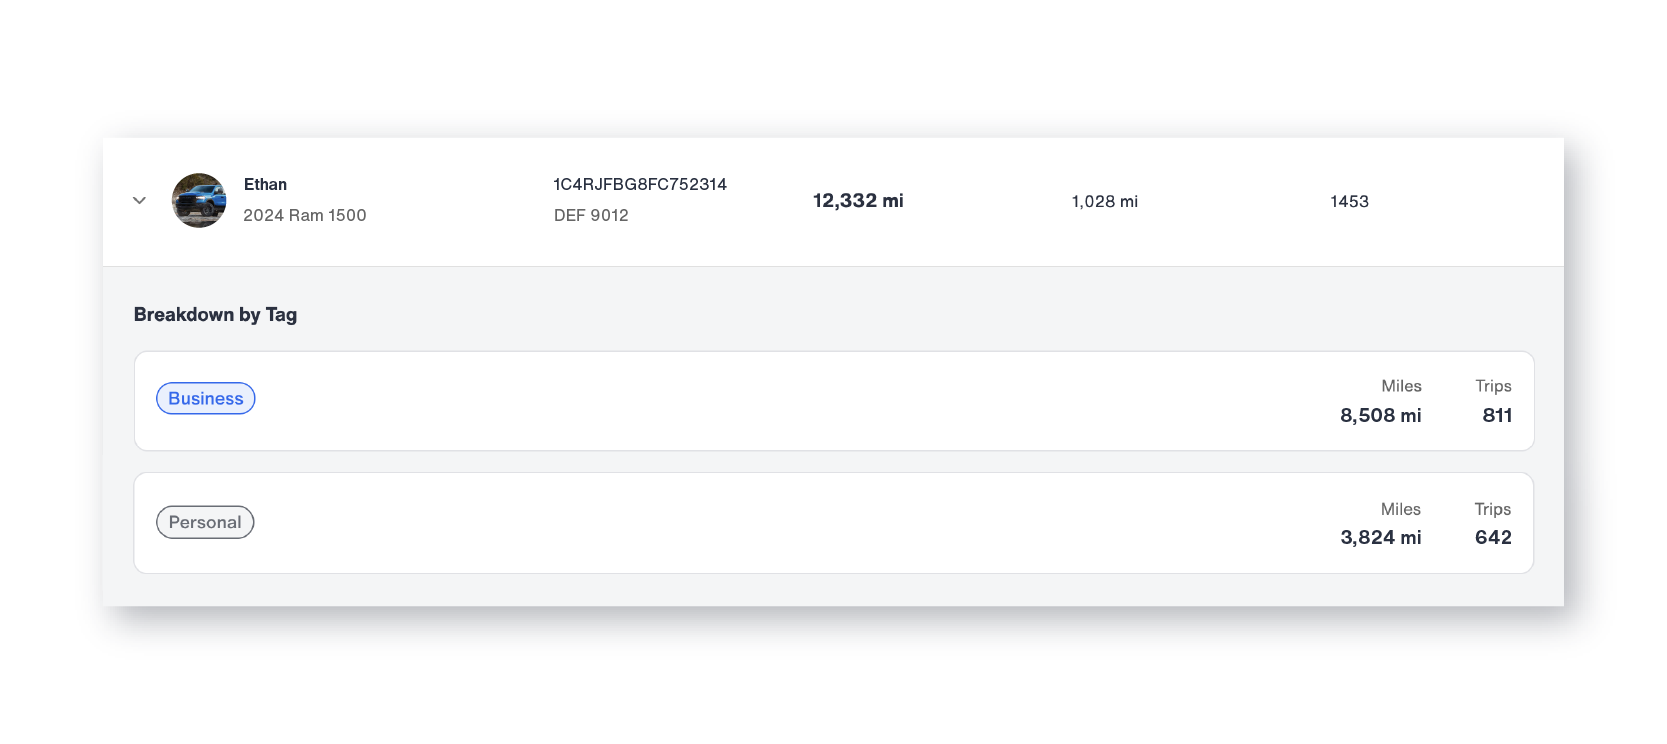
This detailed breakdown supports deeper analysis. A service company may identify which vehicles are handling the majority of jobs. A growing business can determine whether certain vehicles are approaching maintenance thresholds. A family can compare usage between drivers.
Because the report consolidates all vehicle data into one view, you avoid manually calculating totals or reconciling separate monthly records.
Once you have reviewed the data, you can download the report in two formats: a summary-level overview or a detailed vehicle-level export. Both are available directly from the dashboard.
Downloading Your Data: Summary and Detailed Reports
One of the most practical benefits of the Year-End Mileage Report is the ability to download your data.
The summary download provides a high-level annual overview suitable for sharing with accountants or business partners. The detailed vehicle-level export includes individual trip and mileage data for each vehicle, making it useful for internal reviews, reimbursement documentation, or fleet planning. Neither format requires any manual reformatting before sharing.
For business owners, this can streamline tax preparation and reimbursement reporting. The IRS requires contemporaneous mileage records for deduction claims, meaning documentation should reflect actual trips as they occur rather than reconstructed estimates. Because Bouncie automatically logs every trip throughout the year, your year-end mileage report is built on real-time GPS data rather than memory or manual entry, making it a reliable foundation for deductible mileage documentation.
For fleet managers and employers who reimburse drivers at the IRS standard mileage rate, downloads of your fleet data provide the vehicle-level documentation needed to support reimbursement calculations, annual reviews, and planning discussions for the upcoming year.
For independent professionals such as real estate agents, consultants, and self-employed contractors, having a clean annual mileage download simplifies IRS mileage recordkeeping and deductible mileage calculations at tax time.
The ability to move directly from dashboard insights to download-ready documentation eliminates the need for separate spreadsheets or manual data entry.
Why Consistent Device Installation Keeps Your Mileage Report Accurate
While the Year-End Mileage Report is comprehensive, it does rely on consistent device installation. Bouncie can only report data for vehicles that have an active device installed. If a device was uninstalled while the vehicle was still being driven, mileage during that time will not be captured in the report.
Frequently Asked Questions About the Year-End Mileage Report
Can I use the Year-End Mileage Report for tax purposes?
Yes. The report provides GPS-verified mileage data organized by vehicle and month, which can serve as supporting documentation for business mileage deductions. For specific tax guidance, consult a qualified tax professional.
How far back does Bouncie track mileage?
Bouncie retains trip data on an ongoing basis. The Year-End Mileage Report allows you to select the previous calendar year, and previously generated reports are saved under the Generated Reports section for easy access.
What if I added a vehicle partway through the year?
The report will reflect only the mileage recorded while a Bouncie device was actively installed in that vehicle. Miles driven before installation will not appear in the report.
Can I generate reports for multiple vehicles at once?
Yes. The Year-End Mileage Report consolidates all Bouncie-installed vehicles into a single report, with individual vehicle breakdowns available in the details table.
Why Bouncie Makes Year-End Mileage Reporting Effortless
What makes this feature especially valuable is that it does not require additional work throughout the year. Bouncie automatically collects trip data using GPS as vehicles are driven, capturing start and end points, distance, and timing for every trip. Unlike manual mileage logs or odometer-based estimates, every mile in your year-end mileage report is backed by actual GPS data. The Year-End Mileage Report simply brings that data together in a structured, easy-to-understand format. There is no need for handwritten logs. No need to reconcile spreadsheets. No scrambling at the end of the year.
Instead, you gain:
- Centralized reporting across all vehicles
- Flexible filtering using tags
- Clear monthly trend analysis
- Download-ready documentation
Whether you manage a small fleet, operate a growing service business, or oversee multiple family vehicles, the ability to review and document annual mileage in one place brings clarity and confidence.
As your vehicle usage grows, your reporting scales with you.
Turn Annual Mileage into Actionable Insight
Year-end reporting should not feel overwhelming. With Bouncie's Year-End Mileage Report, you can move from scattered trip data to a clear annual mileage summary in minutes. You gain visibility into monthly trends, detailed breakdowns by vehicle, and download-ready documentation suitable for tax filing, reimbursement reporting, or fleet planning.
The Year-End Mileage Report gives you more than a mileage total. It gives you a structured, GPS-verified record of how every vehicle in your account was used across the full year, organized in a format that supports tax documentation, reimbursement reporting, fleet planning, and informed decision-making.
If you are already using Bouncie, your annual mileage data is ready and waiting inside your dashboard. If you are still relying on manual logs or spreadsheets to track vehicle mileage, Bouncie automatically captures every trip throughout the year so your year-end mileage report is always complete and ready when you need it.
Generate your Year-End Mileage Report in Bouncie today and turn a full year of vehicle data into clear, download-ready documentation you can actually use.